03_visualization
Visualizing atomic and big graphs ![]()
Install the package from pip (skip this step if the package is already installed)
[ ]:
! pip install ligning
[12]:
# set ligning path (optional if installed via pip)
import sys, os
project_path = os.path.abspath(os.path.join(os.getcwd(), '..\..\..'))
print(project_path)
sys.path.insert(0, project_path)


import os
import numpy as np
import time

import ligning.monomer as mono
import ligning.polymer as poly
import ligning.utils as ut


import networkx as nx
import time
from rdkit import Chem

output_path = os.path.join(os.getcwd(), 'demo_results', 'molecules')
c:\Users\yifan\Documents\GitHub\LigninGraphs
Create a polymer
[6]:
'''
Starting from a H monomer
'''
P0 = mono.Monomer("H")
polymer = poly.Polymer(P0)
G1 = polymer.G.copy()
ut.draw_atomic_graph(G1)

'''
Add a H monomer with beta-O-4 bond
'''
polymer.add_specific_linkage('beta-O-4', monomer_type = 'H')


#%%
'''
#Add n random monomers with beta-O-4 bonds and time the speed
'''
# 100 monomer takes ~0.9s
# 1000 monomer takes ~80s
start = time.time()
n_iter = 10
for i in range(n_iter):
    if i%2 ==0:
        polymer.add_specific_linkage('beta-O-4', monomer_type =  'G')
    else:
        polymer.add_specific_linkage('beta-O-4', monomer_type =  'S')
end = time.time()

n_monomer = n_iter + 2
run_time = end - start

print("Lignin polymerization: %2d monomers takes %5.2f s" %(n_monomer, run_time))
Connect a H to a H unit (in polymer) via a beta-O-4 bond
Connect a H to a G unit (in polymer) via a beta-O-4 bond
Connect a G to a S unit (in polymer) via a beta-O-4 bond
Connect a S to a G unit (in polymer) via a beta-O-4 bond
Connect a H to a S unit (in polymer) via a beta-O-4 bond
Connect a S to a G unit (in polymer) via a beta-O-4 bond
Connect a G to a S unit (in polymer) via a beta-O-4 bond
Connect a S to a G unit (in polymer) via a beta-O-4 bond
Connect a G to a S unit (in polymer) via a beta-O-4 bond
Connect a G to a G unit (in polymer) via a beta-O-4 bond
Connect a S to a S unit (in polymer) via a beta-O-4 bond
Lignin polymerization: 12 monomers takes  0.03 s
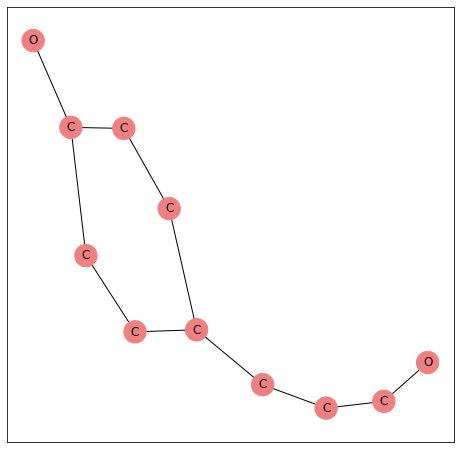
Plot the atomic graph
[7]:
print('Drawing atomic graph:')
ut.draw_atomic_graph(polymer.G)
Drawing atomic graph:

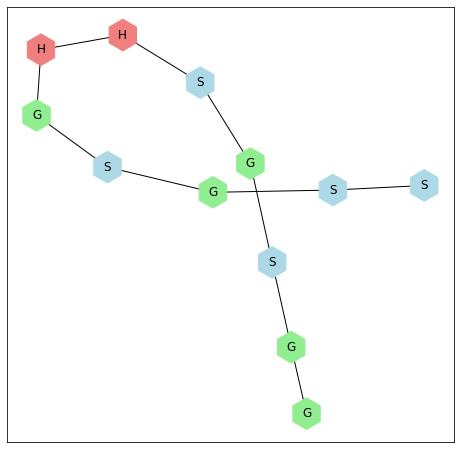
Plot the big graph
[8]:
print('Drawing big graph:')
ut.draw_big_graph(polymer.bigG)
Drawing big graph:
Convert graph to smiles
[9]:
Pn_smiles = ut.graph_to_smile(polymer.G)
print('The SMILES of the polymer is: {}'.format(Pn_smiles))
The SMILES of the polymer is: OCC(Oc1ccc(CC(Oc2c(OC)cc(CC(Oc3c(OC)cc(CC(Oc4c(OC)cc(CC(Oc5c(OC)cc(CC(Oc6c(OC)cc(C=CCO)cc6OC)CO)cc5OC)CO)cc4)CO)cc3OC)CO)cc2)CO)cc1)Cc1ccc(OC(CO)Cc2cc(OC)c(OC(CO)Cc3cc(OC)c(OC(CO)Cc4cc(OC)c(OC(CO)Cc5cc(OC)c(OC(CO)Cc6cc(OC)c(O)cc6)cc5)c(OC)c4)cc3)c(OC)c2)cc1
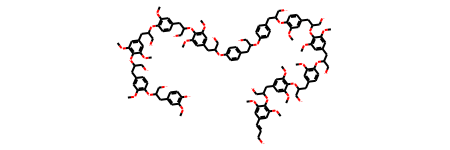
Convert smiles to mol and save the mol structure to an image file
[10]:
Pn_mol = ut.graph_to_mol(polymer.G, save_mol=True, name='mol_structure_viz', save_path=output_path)
print('Drawing the molecular structure: ')
Pn_mol
Drawing the molecular structure:
[10]: